Raman spectroscopy
In tumour surgery, it is highly desirable to have rapid and reliable ways to characterise surgical margins as free (or otherwise) of malignant tissue. Such evaluation methods should ideally work in real-time applications, preferably in the operating theatre and without additional need for sample preparation. The traditional way to obtain rapid information about tissue characteristics during surgery is a frozen section, where a biopsy is taken, immediately frozen and investigated in the histology laboratory. Unfortunately, this method is notoriously inaccurate. It is, therefore, not surprising that alternative methods for rapid tissue characterisation haven been / are being explored. For example, some early promising results have been reported for the use of a specific form of mass spectrometry in breast surgery; the method is currently (2019) being explored for applications in oral and maxillofacial surgery.
Of the many, well-established analytical techniques a particular form of vibrational spectroscopy holds promise as a suitable tool for rapid tissue characterisation: Raman spectroscopy. Some initial applications, with promising early results have been reported in the literature, most of it in pre-clinical settings but some already transitioning to clinical use. Below we give a brief outline of the working principles of Raman spectroscopy, followed by a short discussion of the favourable aspects of Raman spectroscopy as a potential future real-time tissue-evaluation tool.
When thinking about molecules and vibrational spectroscopy, it is useful to take a purely mechanical view of a molecule. In this mechanical model, an atom is represented by a mass; chemical bonds are represented by springs of different length and stiffness, connecting the ‘atoms.’ Such a mechanical molecule would have a characteristic vibrational behaviour, according to its construction from different masses and springs in a particular configuration. This would be different for each different kind of mechanical molecule. In fact, this mechanical view of molecules translates rather well to the vibrational characteristics of real molecules, to what is called a bond strength in chemistry (where strong chemical bonds correspond to stiff springs, and weaker chemical bonds to softer springs), and to ‘fingerprinting’ specific molecules according to their vibrational spectra.
Raman spectroscopy (named after the physicist C.V. Raman who discovered the effect and for which he was awarded the physics Nobel prize in 1930) is a variant of vibrational spectroscopy. In Raman spectroscopy, the vibrational characteristics (the ‘vibrational states’) of molecules are interrogated by shining monochromatic light onto the sample (Figure 1).
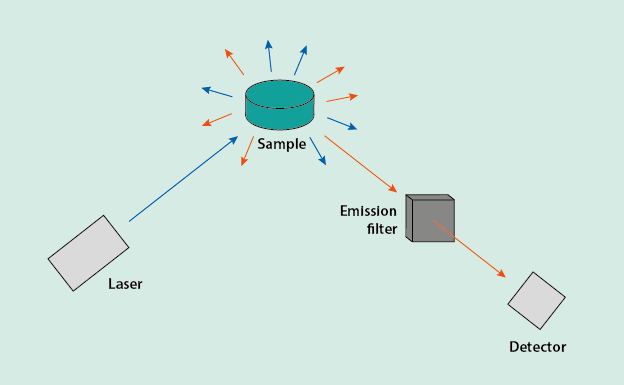
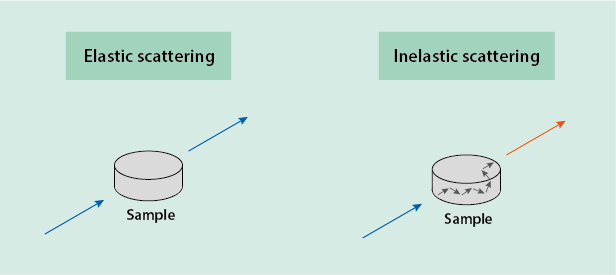
The monochromatic light is typically provided by a laser, the wavelength of the light / the photons (particles of light) is usually in the infrared to ultraviolet range of electromagnetic radiation. When the incoming light hits the sample, most of the light is scattered without any further interaction with the sample. This bouncing of the incoming light off the sample is known as elastic scattering, it preserves the wavelength of the incoming light. The outgoing light after elastic scattering has the same wavelength as the incoming light as no energy is exchanged between the sample and the light.
A small portion of the incoming light, however, does interact with the vibrational levels of the sample under investigation. This effect is known as inelastic scattering and forms the basis of Raman spectroscopy. This interaction between the incoming light and the sample may promote the molecule(s) to a higher vibrational state (the most common type of interaction) by ‘borrowing’ the appropriate amount of energy from the incoming laser light. This obviously reduces the energy of the light, and the emitted light in that case will have a wavelength longer than that of the incoming light. The interaction / energy transfer may rarely also work the other way round, when a molecule is already in a higher vibrational state and, on returning to its lower vibrational state, ‘donates’ the corresponding amount of energy to the incoming light. In that case, the emitted light will have a shorter wavelength than the incoming light / photons (Figure 2).
Since only a small proportion of the outgoing light will have undergone inelastic scattering, it is technically important at the detector stage (Figure 1) to filter out all the light that has the same wavelength as the incoming light. After passing this wavelength filter, only the vibrational fingerprint of the investigated sample following wavelength changes due to inelastic scattering is recorded, in the form of a graph.
Raman spectroscopy is a highly suitable form of vibrational spectroscopy for the investigation of biological materials where water is ubiquitous. The Raman effect is influenced very little by the presence of water (much in contrast to, for example, traditional infrared spectroscopy where water molecules strongly absorb the irradiation beam). It is essentially a non-destructive technique. Another distinct advantage is that it takes very little time to acquire a Raman spectrum and there is no need to prepare the sample. Thus, the technique can be used in situ (in addition to measurements on contained samples) and further lends itself to localised spectroscopy and even microscopy approaches: scattering data can be acquired from very small volumes of less than 1 µm diameter. The experimental set-up as summarised in Figure 1 is simple and consists of small units, and thus is easy to accommodate, for example in an operating theatre.
In many analytical applications of Raman spectroscopy and other spectroscopies, the ‘spectrum / graph’ is the final output. In analytical applications of vibrational spectroscopies this is typically a vibrational fingerprint of a particular compound, material or other sample. However, if the aim is to use the method as a tool to distinguish healthy from unhealthy tissue, then this spectrum output only represents the penultimate step in the procedure.
Tissue evaluation requires the observed graph to be compared to graphs in a data base, covering a suitable range of graphs obtained from healthy and diseased tissues. Not only does such a data base have to be composed of a fairly large number of high-quality entries to allow a statistically meaningful comparison, it is also required that there is/are uniquely identified marker(s) / characteristic(s) in the graphs to distinguish between healthy and diseased tissue. For example, if mass spectrometry is used for the evaluation of surgical margins in breast surgery, the phospholipid profiles in healthy and diseased tissue provide this distinction.
One possibility to distinguish between healthy and diseased tissue in oral cancer surgery by means of Raman spectroscopy is the different water content of healthy (low) and malignant (high) tissue. For example, measurements on freshly excised oral squamous cell carcinoma (the most common form of oral cancer) of the tongue were compared with the results of traditionally stained biopsy preparations and were found to be 99 % sensitive and 92 % specific. A number of studies compare Raman spectroscopy and microscopy results for different solid tumours with H&E stained biopsies, with generally very good agreement. Such assessments have been carried out for soft and hard tissue resections in surgery of oral malignancies. There are numerous initial studies of in vivo and in vitro applications of Raman spectroscopy for a number of different applications in oncological surgery. Most of these studies have in common that they provide encouraging results for the establishment of a novel real-time assessment of surgical margins. The majority of these studies further have in common that they are mostly in a pre-clinical or trial stage, and that the most important next step in the development of the methodology is the establishment of robust algorithmic methods for data evaluation and the building of meaningful data bases. This is likely to take several, if not many, years from now (2019). Some such developments may well benefit from learning algorithms and other forms of artificial intelligence. A particularly worthwhile direction to pursue on the methodology side, other than algorithmic considerations, may be in the area of in situ / in vivo tissue evaluation before resection; this may become possible by using fibre optics in a miniaturised experimental set up.