CT scans
Contents
Tomography is defined as a technique for obtaining a representation of the internal structures of a solid object by scanning said object with penetrating waves (usually electromagnetic radiation). The probing technique needs to be chosen such that the acquired data set can provide a faithful representation of the three-dimensional structure of the object. A three-dimensional map of the structure is constructed by digitally processing the set of data, and converting these into a true mapping of the internal structures of the scanned object. This part of the process refers to the common term ‘computed tomography’ (CT).
X-rays are one form of electromagnetic radiation / waves that can provide tomographic data. Series of measurements from different, well-defined angles with respect to the scanned object are taken. Such series of X-ray measurements, subsequently processed with digital image reconstruction algorithms, are a common diagnostic imaging technique, loosely known as ‘CT scan’.
Below we give an overview of how the data is stored, discuss the basic working principles of X-ray based CT scans and some of the associated image artefacts, and summarise the main oral & maxillofacial surgery applications of X-ray based CT scans.
The data: pixels & voxels
On a computer, graphics can be represented in two ways; as raster or vector graphics. In raster graphics (also known as bitmaps), a two-dimensional image is made of many pixels, the image is an array of small elements (Figure 1) that, for example may have colour values assigned to them. Each pixel can be located by its position according to the corresponding values of an x,y-coordinate system associated with the pixel map and its main assigned property is its ‘colour value’, in our example in Figure 1 different shades of grey. Raster graphics make image magnification difficult without loss of image quality/sharpness.
The same principles apply in three dimensions, the corresponding small three-dimensional sub-units are called voxels (Figure1). Voxels correspond to locations according to x,y,z-coordinates, again ‘colour value’ is their main characteristic in our example. In general, pixels/voxels can be ascribed all kinds of different characteristics, expressed as some (scalar) value such as density, opacity, colour, and flow rate as function of location. This makes the pixel/voxel concept useful and versatile for the visualisation of many different properties of matter in three dimensions, including medical imaging methods.
X-ray data obtained in a CT scan are a set of voxels and, generally in X-ray imaging and X-ray based CT scanning, the pixel/voxel colour values encode relative radio-density. The pixels/voxels are conventionally displayed in a shade of grey, representing the mean attenuation of the X-ray beam for a particular pixel/voxel location (with the convention that white corresponds to the highest X-ray absorbance, black corresponds to the lowest).
Using voxels for image reconstruction of a faithful three-dimensional image, without distortions, requires that the voxels are isotropic, that is they must have the same length in every direction; x,y,z. In our example (Figure 1), the pixels filling the two-dimensional grid are little squares, the voxels filling the three-dimensional grid are little cubes. Early CT scanners were capable of producing axial images which were able to be viewed only slice by slice in one plane (see below), but when viewed in other planes the image quality would be poor because of unequal x,y,z-dimensions of the voxels. Isotropic voxels allow image reconstructions in any plane as well as manipulation of the three-dimensional images such as rotating the whole image on a screen in every direction.
The number of pixels/voxels used in image reconstruction defines the resolution of the image. This is illustrated in Figure 2, where a triangle has been constructed by a (low-resolution) 10 x 10 pixel array, and a (higher-resolution) 100 x 100 pixel array. Obviously, the image is more accurately defined with the higher pixel count. The same argument applies when working with three-dimensional voxels. This is an important aspect of X-ray CT imaging. Clearly, the more voxels, the better quality / higher resolution image can be produced. However, an increased voxel count corresponds to an increased X-ray, high-energy radiation exposure, which is undesirable. Diagnostic medical applications of X-ray based CT scans need to strike a reasonable compromise between data and image resolution, and radiation exposure. Different applications and purposes of diagnostic X-ray CT scans have slightly different requirements in terms of resolution.
Basic working principles of X-ray based CT scans
Conventional plain film X-ray imaging uses one radiation beam, and projects the three-dimensional volume information about an object into a two-dimensional image. All signatures of bone and tissues structures are superimposed. This often makes it impossible to identify uniquely some tissues / lesions and/or their exact location(s) and extent. CT instead creates a three-dimensional data set by scanning an object with a series of narrow X-ray beams from different directions. The series of X-ray beams moves through an arc shape.
Each single measurement taken during a CT scan records the structure and/or composition of the section of the object it travels through. The measured value attached to each volume element scanned is encoded in the respective voxel (see above). This measured value in X-ray based CT scans is the attenuation of each individual X-ray beam as it passes through the body.
In both conventional film X-ray images and CT scans, image contrast is defined by the difference in attenuation of two neighbouring regions. Attenuation is quantified for each structure by an ‘attenuation coefficient’, a value which describes the loss in energy of the X-ray beam as it passes through the material. In conventional plain film X-ray images, the contribution from structures with low attenuation is obscured/dominated by structures with high attenuation during the superimposition from three-dimensional object information into a two-dimensional image. In CT scans, contrast is determined locally across each section, and neighbouring structures have little influence on the reading from the scanned section. A sketch of the measurement of attenuation coefficients is shown in Figure 3, where a scanned section of the brain is symbolised by nine areas with different attenuation coefficients.
The image of the object is reconstructed from a large number of measurements of the attenuation coefficient taken across different angles. Due to the X-ray passing through multiple structures, the measured attenuation coefficient is essentially a summation of all the coefficients of the areas that the beam passed through. Accordingly, a large data set is necessary in order to be able to completely and unambiguously identify all these different coefficients and their respective voxel locations. The measured data are compiled into a digital data base, and mathematical algorithms translate the set of measured attenuation coefficients into ‘CT numbers’, which determine the greyscale value of each voxel in the visual representation.
Following image reconstruction, the data from an X-ray based CT scan can be manipulated and inspected in many different ways. Inspection of the three-dimensional images across the axial, coronal, or sagittal anatomical planes (Figure 4) are common ways to examine the image data.
The anatomical axial plane (or transverse plane) divides an object into ‘head and tail’ / ‘up and down’ portions. It can be visualised as moving horizontally through the object. The coronal plane (or frontal plane) divides the object into ‘back and front’ portions. It can be visualised as moving vertically through an object. The sagittal plane divides the object into left and right portions, and also can be visualised as moving vertically through an object.
Now that we have discussed the data processing techniques important for CT scans, next we need to briefly consider the set-up and operation of a CT scanner as a whole (Figure 5). The mechanical operations of a CT scanner are the movement of components about the scanned object. The X-ray tube rotates about the object whilst the detector, built as an enclosed ring, does not move. The energy supplied to generate the X-ray beams and the rotation of the X-ray tube are controlled by a central computer. Once the X-ray tube has performed a full rotation, all the attenuation coefficients acquired during the scan are transmitted to the central computer. The digital data set is then reconstructed by a suitable algorithm to yield an image, which can be viewed on a display and/or the data used for three-dimensional printing of models.
The faithful and precise three-dimensional representation of internal structures from an X-ray-based CT scan comes at the cost of a considerably higher radiation dose in comparison to conventional two-dimensional X-ray images.
Some technical details about CT artefacts
Images obtained by X-ray based CT scans are generally faithful and accurate representations of the scanned objected, given a suitable resolution. However, like any other technology in the real world, CT scanning techniques are susceptible to some artefacts, outlined below.
When an X-ray beam, comprised of photons with a normal distribution of energies about the mean beam energy passes through an object, there is attenuation of the lower-energy photons leading overall to an increase in the mean beam energy (Figure 6). This phenomenon is called beam hardening. During image processing, the effect of this increased beam energy can then be misinterpreted as being caused by the material being less attenuating relative to surrounding objects.
In CT scans, beam hardening manifests as two artefacts: streaking and cupping. Streak artefacts can appear as dark bands positioned between two different dense materials. It occurs due to the different pathways of the beams during the series of scans. The portion of the beam that passes through just one material will have a different rate of hardening, compared to a beam that passes through both materials.
Cupping artefacts are the presence of falsely bright voxels along the periphery of an object (Figure 7). This happens because X-ray beams passing through an object will have a higher rate of hardening in the centre than near the edges as they are passing through more material.
Such artefacts can limit the diagnostic efficacy of the image. Therefore, beam hardening artefacts are kept at a minimum by fitting modern CT scanners with metallic attenuating structures. These structures harden the X-ray beam before it reaches the scanned object.
Image reconstruction techniques assume that the X-ray attenuation within each voxel has the same value. In practice, this assumption is false due to the presence of defined edges that may lead to incompletely ‘filled’ voxels (Figure 8).
This causes an artefact called the partial volume effect, which manifests as the edges of scanned objects becoming blurred. The main strategy for decreasing partial volume artefacts is to use the highest reasonable resolution, that is smaller, more sharply-defined voxels. Obviously, there are limits to this mitigation of limited-resolution artefact, especially keeping in mind the need to minimise exposure to high-energy radiation.
There is another aspect to aiming for very small voxel volumes that puts a lower limit to a reasonable voxel volume. Once data are collected from a very tiny volume, the data will display a low signal-to-noise ratio, simply because there is not a lot of signal to be read from a very small volume (a well-known and closely related problem also exists in MRI approaches). Noise decreases the image quality as it may make voxels across a homogeneous material appear inhomogeneous. Another potential source of noisy image data is insufficient power supplied to the X-ray tube to permit complete penetration of the scanned object. Most image reconstruction algorithms include so called noise reduction techniques, mathematical tricks to enhance the signal-to-noise ratio in data sets at the expense of losing some diagnostic power.
Other artefacts may be ascribed to imperfections of man (for example, voluntary or involuntary motion of a person during a CT scan series) and/or machine. For example, so called ring artefacts are fairly common in CT scans of the head, appear as additional features in the images, are caused by miscalibration or failure of some detector elements, and may require re-taking the scan.
Common maxillofacial applications of X-ray based CT scans
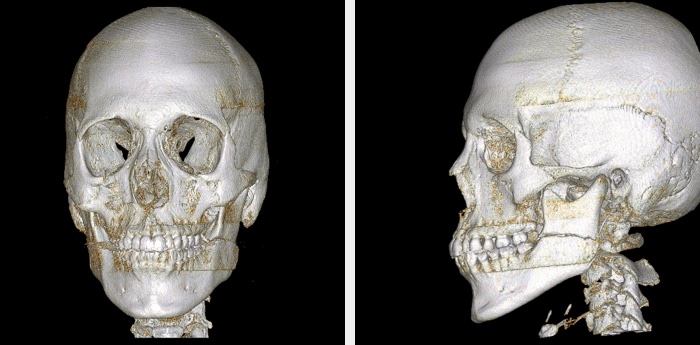
In line with the strengths of conventional two-dimensional X-ray images, the natural strengths of X-ray based CT scans also reside in the characterisation of hard and dense materials, such as bones. Figure 9 shows an example of accurate depiction of damage in a midface fracture.
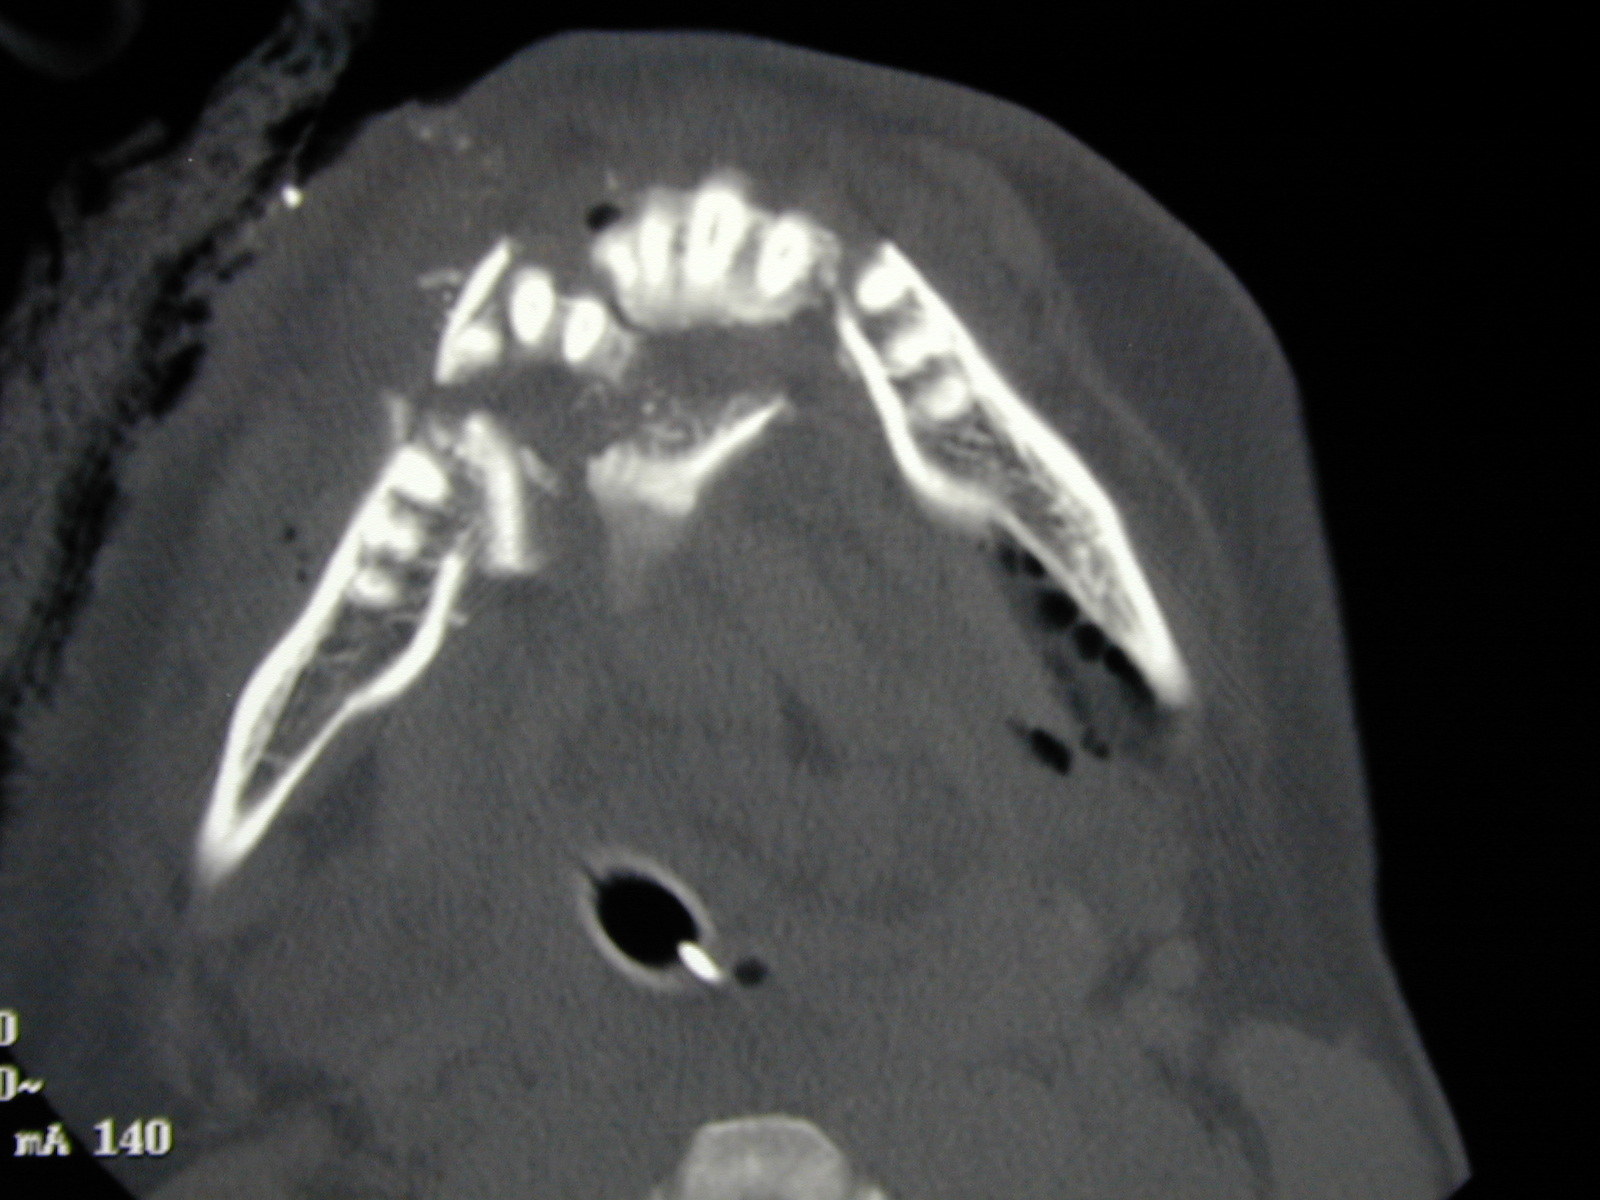
The most common applications of X-ray based CT scans in maxillofacial surgery include the investigation of fractures (Figure 10), sometimes in conjunction with investigation of brain injury in acute trauma (this creates an issue as bone and brain ‘windows’ and ‘slices’ are quite different; see above).
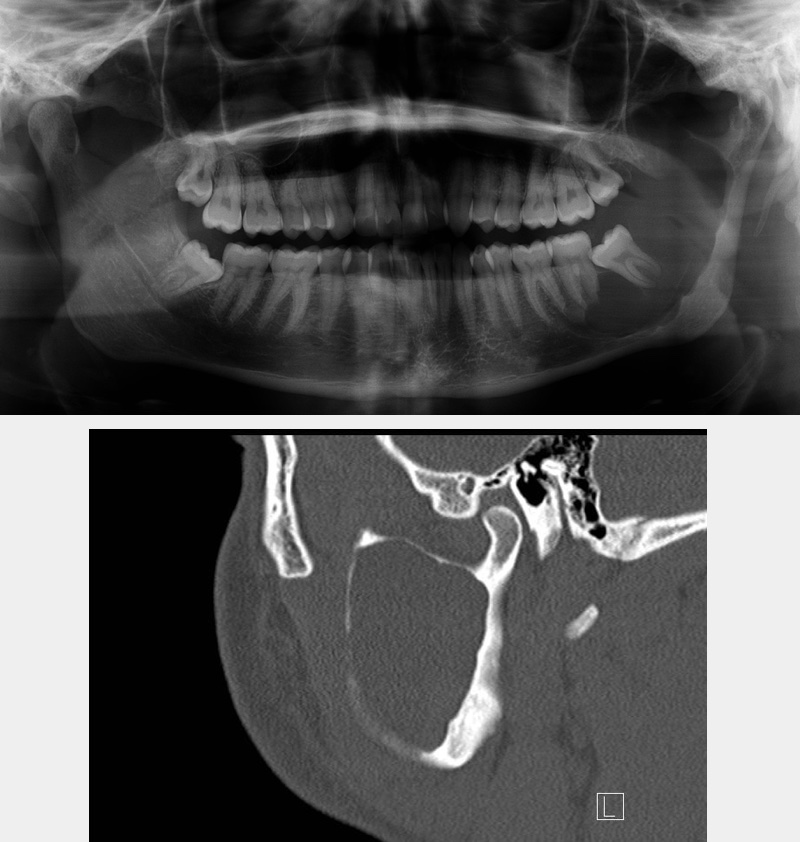
Other applications include a range of bone lesions such as cystic lesions of the jaws (Figure 11).
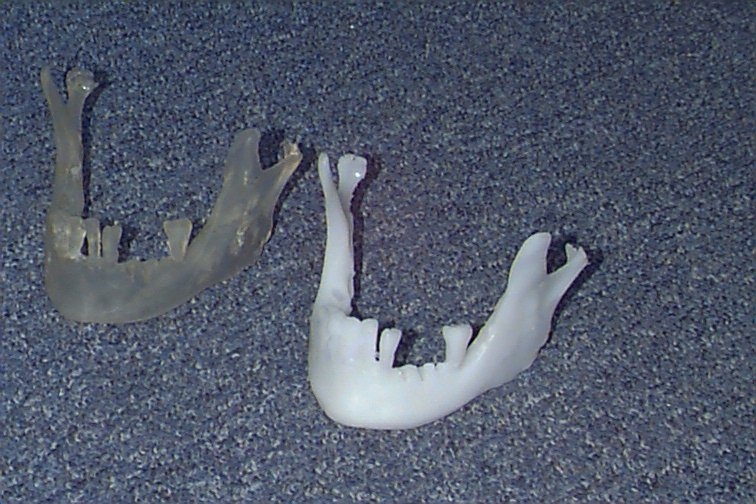
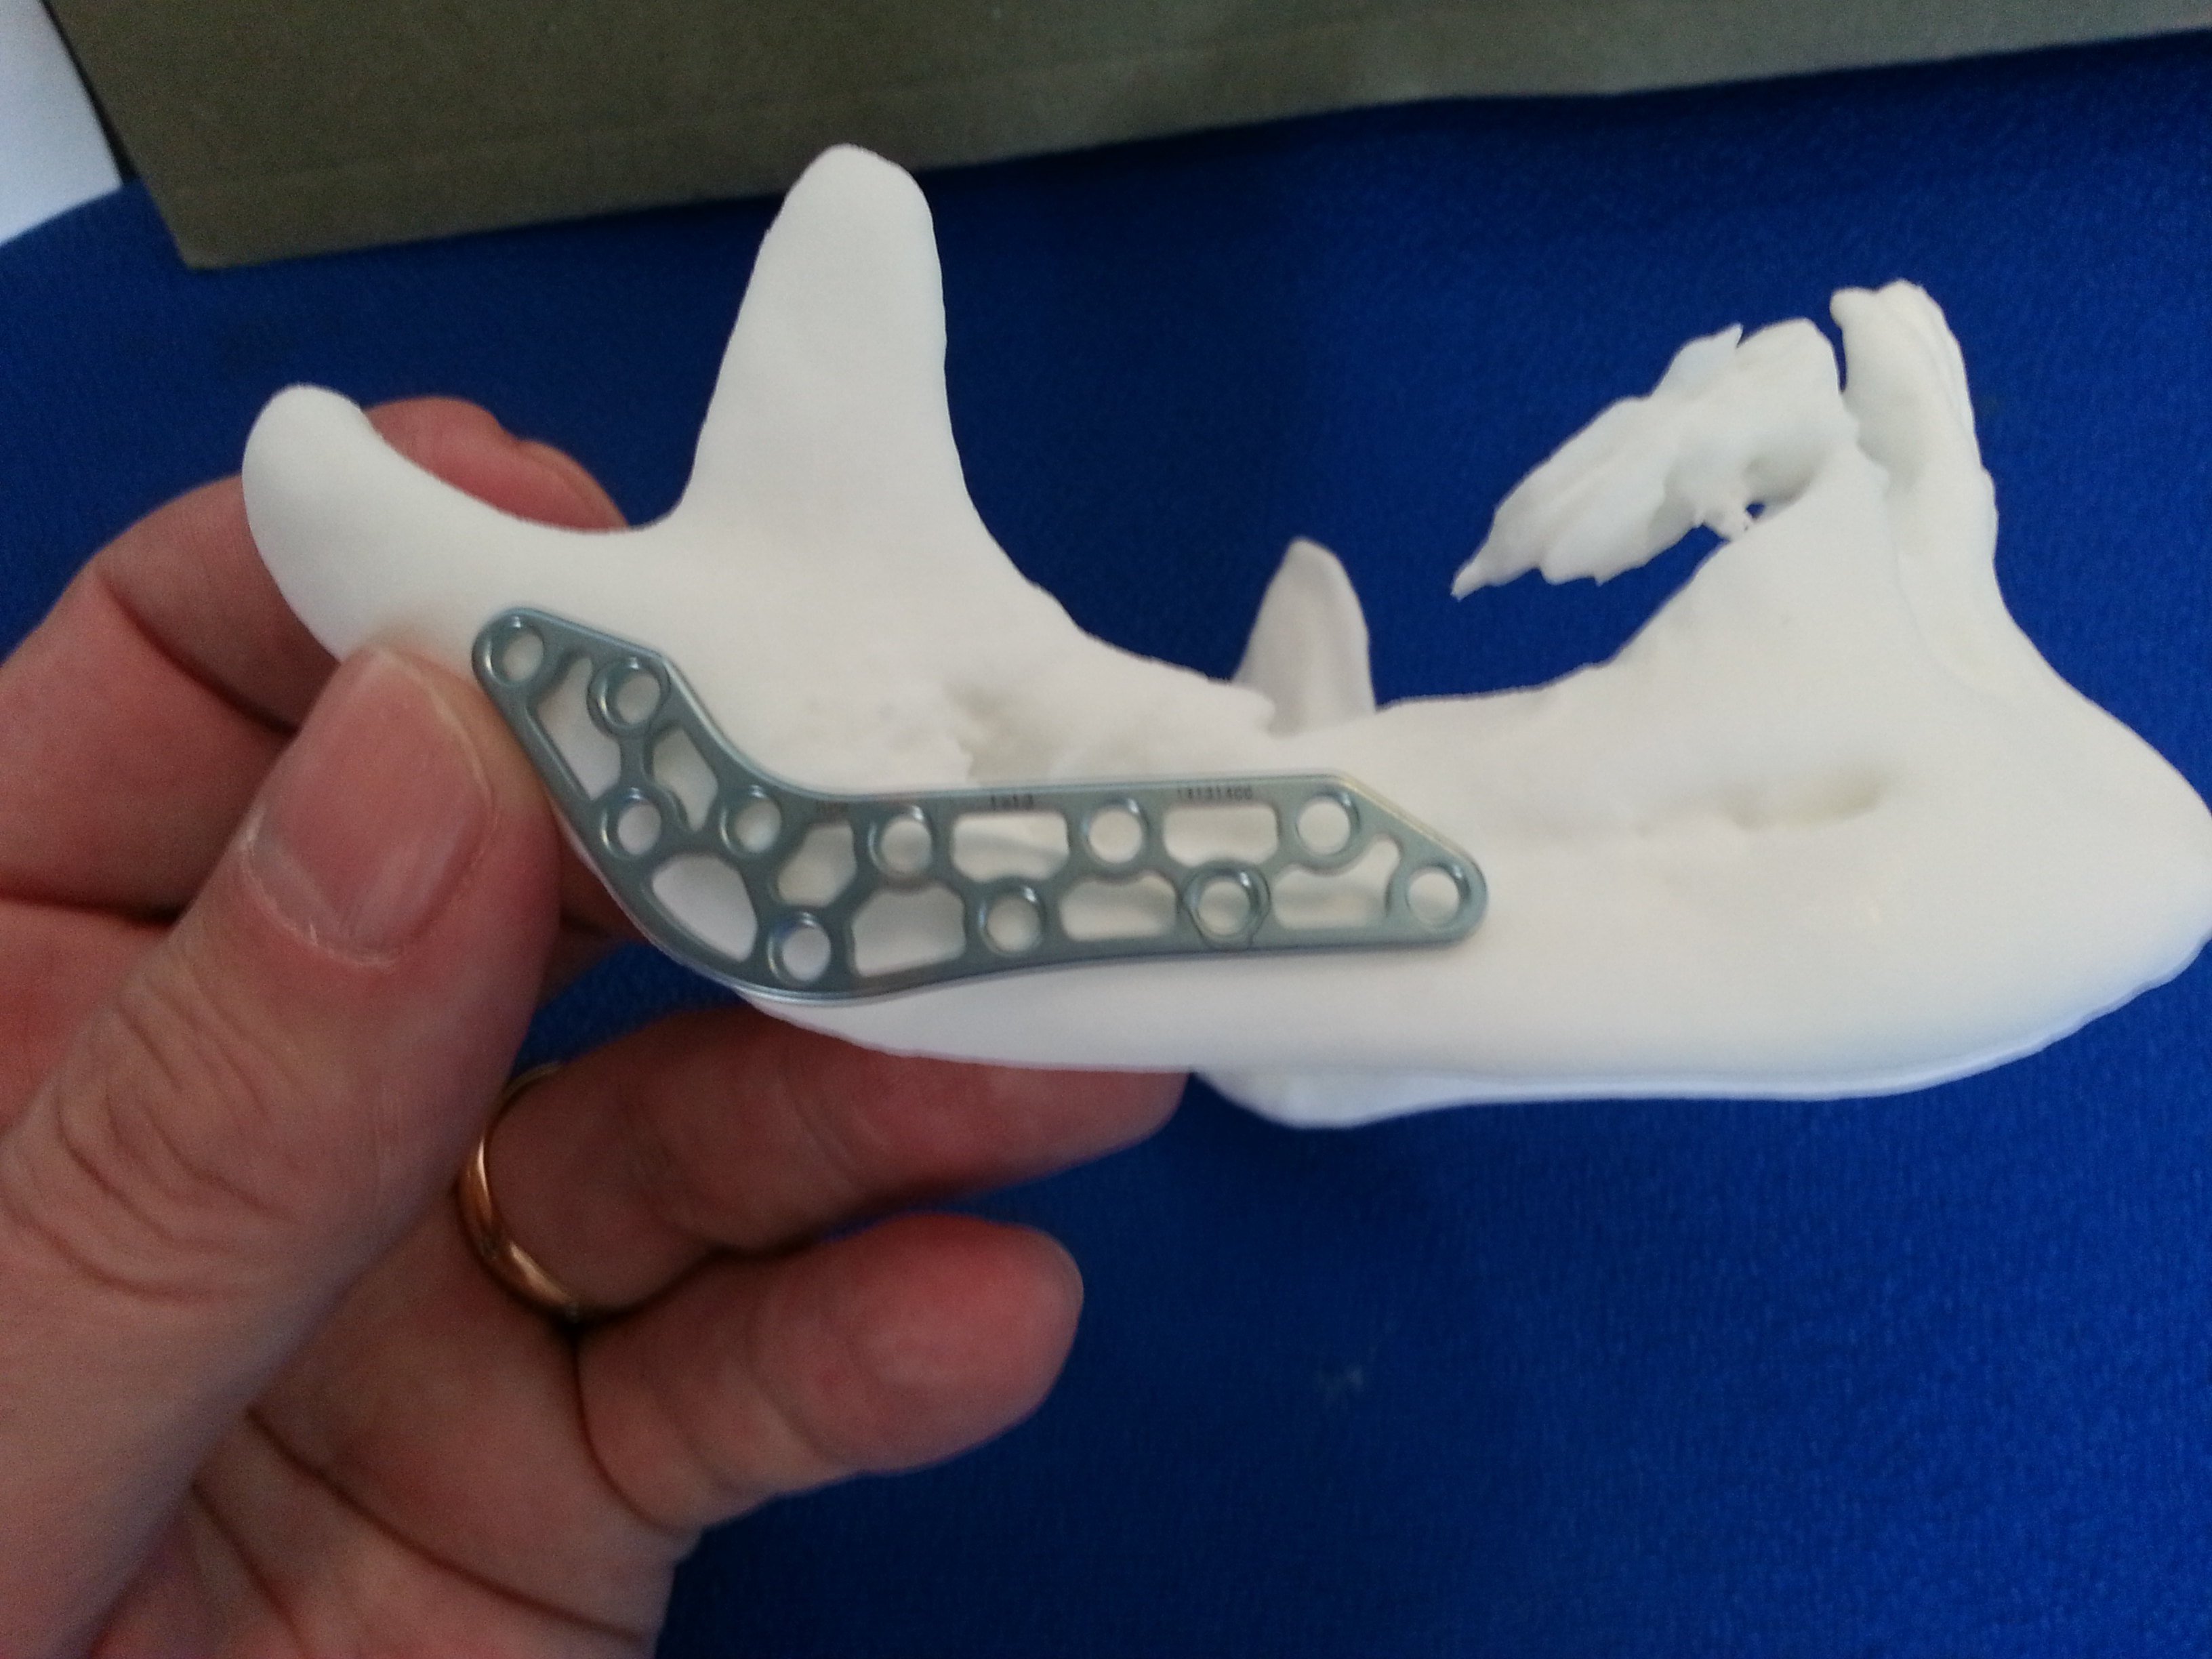
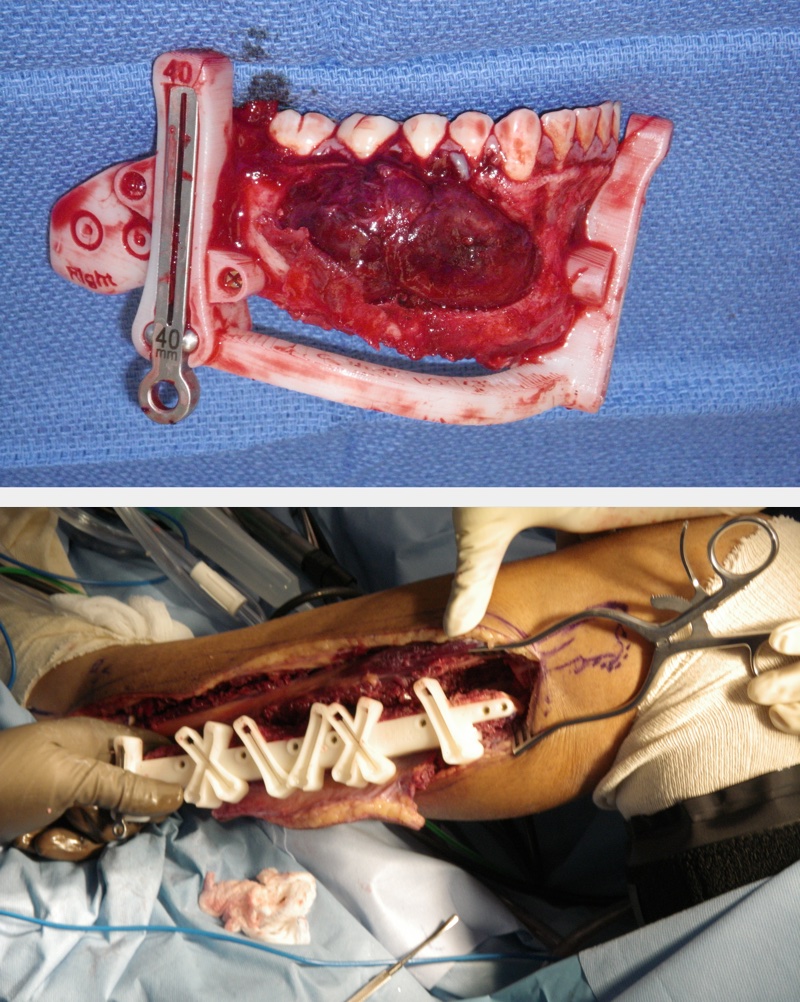
X-ray based CT scans play an important role in pre-surgical planning for reconstructive surgery where both the resection and the donor site may need investigation. Increasingly fast access to CT scans can allow both predictive surgical resection and three-dimensional reconstruction planning. Three-dimensional printing from high-resolution X-ray based CT scan data allows models, or even jigs, to be fabricated which guide the surgical cuts, improving precision and minimising on-table time in the operating theatre for the patient. Figures 12, 13 and 14 show examples of the use of three-dimensional printing, derived from high-resolution X-ray based CT scans.
Specialised soft tissue CT such as CT/angiograms, PET/CT are less frequently used, although a simple thoracic CT scan is part of the routine baseline workup for patients with head and neck cancer beyond the very early stages. Rarely CT may be used in place of MRI where an MRI contraindication exists (this used to be metal implants; and cardiac pacemakers were a great cause of concern but many modern pacemakers are ‘MRI safe’. Most facial implants placed in the last decade are made from titanium and are therefore ‘MRI safe’ but will still considerably distort MRI data, more so than X-ray based CT images).